
These Are The Most Competitive Rental Markets In 2023 So Far

By Lilly Milman
May 12, 2023
*We calculated the most competitive rental markets in the U.S. right now, using our rental data as well as the Q1 vacancy rates released by the U.S. Census Bureau on May 3, 2023. Worcester, MA came out on top. *
An open house for a rental where there are 10 other applicants eagerly touring, a dream apartment listing that’s taken down before you even get a chance to reach out to the broker, and sky-high rent prices that seem to increase every year. Sound familiar? These are all experiences you may have had if you live in a competitive rental market — meaning, an area where the demand for apartments is outweighing the supply, also known as a low .
Factors that could cause a rental market to become more competitive can include a lack of new residential construction, an influx of new renters, and rising home prices and mortgage rates that cause potential homebuyers to become renters, among other reasons.
To find the current most competitive rental markets in the U.S, we analyzed 71 of the largest metro areas in the United States, creating a competitiveness score for each metro area based on its vacancy rate, average time on market of apartment listings, and median cost per square foot, based on our own rental data as well as data from the U.S. Census. We also considered year-over-year trends, looking at how the competitiveness score and median cost per square foot has changed when compared with 2022. As explained in our methodology, total scores are a weighted average of these metrics, with the highest scores being most competitive.
Below, we've highlighted the top 10 metro areas on our list. You can find the full-ranked list of all 71 metro areas we looked at here.
| Rank | Metro Area | Overall Score |
|---|---|---|
| 1 | Worcester, MA | 81.11 |
| 2 | Washington-Arlington-Alexandria, DC-VA-MD-WV | 76.12 |
| 3 | San Diego-Carlsbad, CA | 74.45 |
| 4 | Louisville/Jefferson County, KY-IN | 73.81 |
| 5 | Rochester, NY | 72.77 |
| 6 | Omaha-Council Bluffs, NE-IA | 72.74 |
| 7 | San Jose-Sunnyvale-Santa Clara, CA | 72.42 |
| 8 | Columbia, SC | 72.39 |
| 9 | Boston-Cambridge-Newton, MA-NH | 70.85 |
| 10 | Bridgeport-Stamford-Norwalk, CT | 69.37 |
Massachusetts’s Two Largest Cities Fall in the Top 10 Most Competitive Rental Markets
Worcester, MA, the second largest city in Massachusetts, is the hardest place to get an affordable apartment in the country right now. Boston, where ApartmentAdvisor is based, isn’t too far behind in the No. 9 spot.
Rent Price Isn’t the Only Indicator of Competitiveness
As of the end of Q1 of this year, the vacancy rate in Worcester is sitting at 1.70% — the second lowest vacancy rate on our list, topped only by the Louisville, KY–Jefferson Country, IN area, which sits at 1.2%. The next lowest vacancy rate is 2.5% in Rochester, NY. For reference, a healthy rental vacancy rate is between 7% and 8%. Vacancy rates have been steadily declining across the country since the mid aughts, according to the Census Bureau, and Worcester is no exception to the trend. Its vacancy rate has been lowering since 2017, indicating a housing shortage.
While Boston’s vacancy rate has also been on the decline since 2017, Census data shows that there is a generally higher vacancy rate in Boston than in Worcester — even though the median rent for a 1-bedroom in Boston is almost $1,000 more per month than in Worcester.

Affordable Housing is Few and Far Between
Massachusetts has long been plagued by its lack of affordable housing development — and renters in both Boston and Worcester are literally paying the price.
While Boston has been one of the country’s most expensive rental market for years, Worcester’s long-time reputation as an affordable urban center is fading. The city has historically had lower price points than Boston, but both cities suffer from a low inventory when it comes to affordable housing. Worcester’s population has grown by about 25,000 people since 2013, says the Census Bureau, and construction of new and affordable housing hasn’t kept up with the demand. According to Boston.com, the city has only added 10,000 housing units in the past decade. High-end real estate development — targeted toward higher-earners, especially those who work in Boston and the MetroWest area — has been increasing since the mid-2010s, but the construction of affordable housing has lagged. Consequently, the cost of rentals has gone up significantly. The median cost per square foot for an apartment increased by 10% between 2022 and 2023 according to our rental data — with the price per square foot rising from $1.75 to $1.93. Meanwhile, the city of Boston approved a historically low number of new housing projects in 2022 — down 60% from 2021 and down 74% from 2020.
High-Density Housing Isn’t Enough to Cool Down Competition in the DC Area
Second on our list of most competitive rental markets is the metro area surrounding the nation’s capital — Washington-Arlington-Alexandria, DC-VA-MD-WV. According to our data, the area has become much more competitive for renters since last year, and saw one of the biggest price hikes in terms of median cost per square foot for an apartment on our list — from $2.32 in 2022 to $2.52 in 2023.
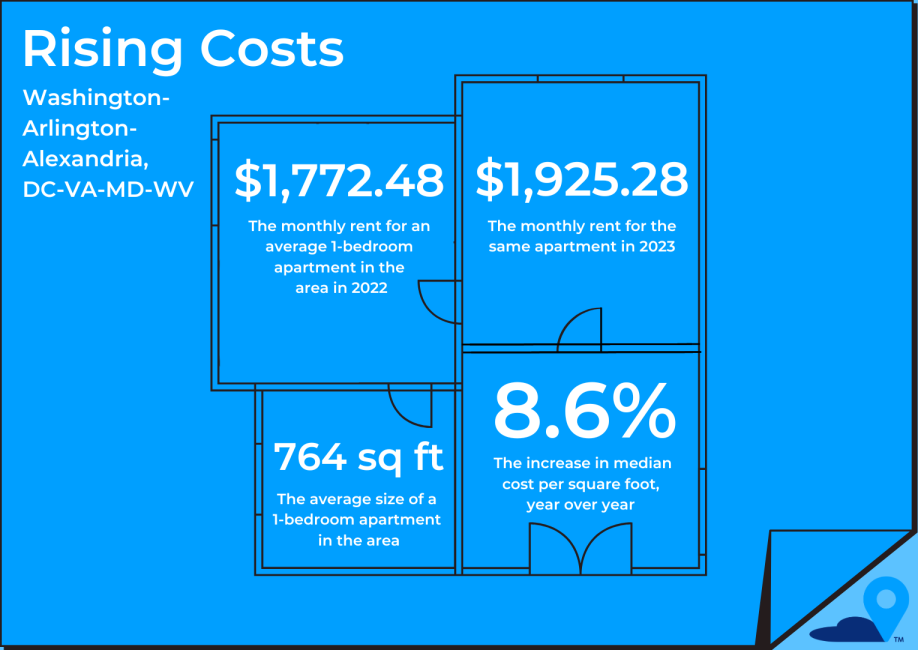
According to the Brookings Institution, a nonprofit public policy organization based in Washington, DC, the jurisdictions in the Washington-Arlington-Alexandria, DC-VA-MD-WV area already have the least undeveloped land and the most high-density development in that region. However, like in our other competitive markets, there isn’t enough supply to keep up with the demand for affordable housing due to population growth.
Midwest Rental Markets Are Heating Up
While the Northeast dominated our list of most competitive rental markets — with four metro areas placing in the top 10 — the Midwest was also shown to be highly competitive. Louisville/Jefferson County, KY–IN and Omaha–Council Bluffs, NE–IA are the No. 4 and No. 6 most competitive rental markets in the U.S. right now.
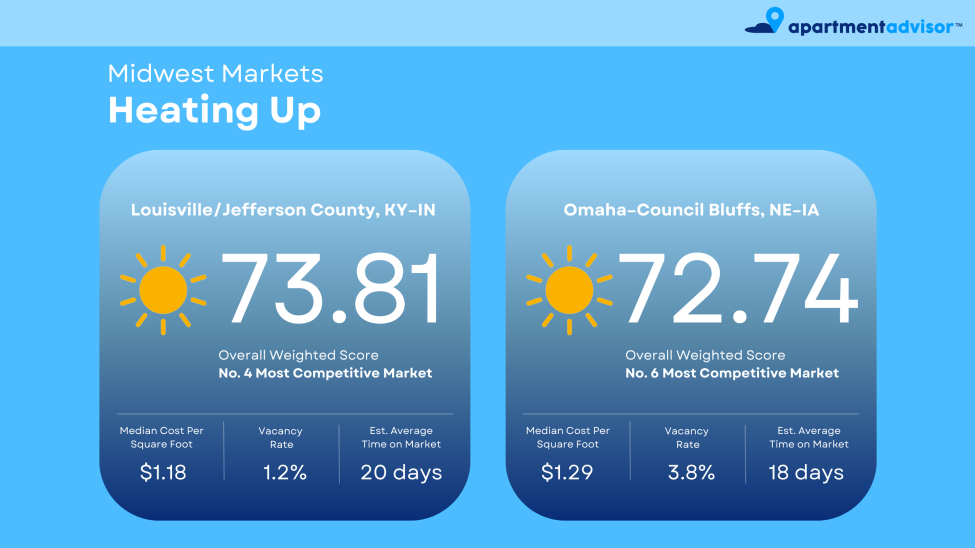
One of the metrics that we used to calculate our overall weighted score was the year over year change in a metro area’s competitive score, comparing Q1 2023 with the same period in 2022. The rental markets in Louisville/Jefferson County, KY–IN and Omaha–Council Bluffs, NE–IA both showed a significant increase in competitiveness since 2022 — meaning that their vacancy rates have lowered, and their rent prices have increased. While both are still in the bottom third of our list in terms of median cost per square foot (with Louisville/Jefferson County, KY–IN at $1.18 and Omaha–Council Bluffs, NE–IA at $1.29), the price tag on an apartment in either market is climbing rapidly. There was a 9% and an 11% increase in the median cost per square foot for an apartment in Louisville/Jefferson County, KY–IN at $1.18 and Omaha–Council Bluffs, NE–IA, respectively, from 2022 to 2023.
Below is the full-ranked list of all 71 cities we analyzed.
The Most Competitive U.S. Rental Markets in Q1 2023
| Rank | Metro Area | Overall Score | Competitive Score | Competitive Trend Score | Price Trend Score |
|---|---|---|---|---|---|
| 1 | Worcester, MA | 81.11 | 89.56 | 58.63 | 97.88 |
| 2 | Washington-Arlington-Alexandria, DC-VA-MD-WV | 76.12 | 71.32 | 77.75 | 99.99 |
| 3 | San Diego-Carlsbad, CA | 74.45 | 84.09 | 46.65 | 99.99 |
| 4 | Louisville/Jefferson County, KY-IN | 73.81 | 74.79 | 84.24 | 36.63 |
| 5 | Rochester, NY | 72.77 | 76.23 | 79.12 | 32.89 |
| 6 | Omaha-Council Bluffs, NE-IA | 72.74 | 73.28 | 76.53 | 58.16 |
| 7 | San Jose-Sunnyvale-Santa Clara, CA | 72.42 | 73.5 | 61.06 | 99.99 |
| 8 | Columbia, SC | 72.39 | 66.91 | 100 | 22.43 |
| 9 | Boston-Cambridge-Newton, MA-NH | 70.85 | 93.13 | 40.05 | 29.65 |
| 10 | Bridgeport-Stamford-Norwalk, CT | 69.37 | 69.85 | 58.19 | 99.99 |
| 11 | Seattle-Tacoma-Bellevue, WA | 68.53 | 73.83 | 69.27 | 34.53 |
| 12 | New Haven-Milford, CT | 68.46 | 69.84 | 55.28 | 99.67 |
| 13 | Charlotte-Concord-Gastonia, NC-SC | 67.38 | 66.09 | 71.17 | 63.75 |
| 14 | Buffalo-Cheektowaga-Niagara Falls, NY | 66.81 | 62.29 | 75.52 | 67.76 |
| 15 | Milwaukee-Waukesha-West Allis, WI | 66.78 | 70.68 | 75.18 | 18.15 |
| 16 | Orlando-Kissimmee-Sanford, FL | 65.8 | 69.86 | 51.94 | 82.98 |
| 17 | Providence-Warwick, RI-MA | 64.83 | 70.17 | 50.21 | 76.61 |
| 18 | Los Angeles-Long Beach-Anaheim, CA | 64.17 | 68.75 | 46.74 | 88.95 |
| 19 | Urban Honolulu, HI | 63.94 | 70.57 | 53.53 | 55.44 |
| 20 | Hartford-West Hartford-East Hartford, CT | 63.01 | 60.01 | 56.66 | 99.99 |
| 21 | Fresno, CA | 62.76 | 69.19 | 68.77 | 6.19 |
| 22 | New York-Newark-Jersey City, NY-NJ-PA | 62.74 | 69.34 | 37.1 | 99.99 |
| 23 | Denver-Aurora-Lakewood, CO | 62.65 | 74.45 | 55.69 | 12.8 |
| 24 | Virginia Beach-Norfolk-Newport News, VA-NC | 62.07 | 66.36 | 63.61 | 31.73 |
| 25 | Chicago-Naperville-Elgin, IL-IN-WI | 62.04 | 76.82 | 53.15 | 0.01 |
| 26 | Cincinnati, OH-KY-IN | 61.43 | 55.43 | 67.66 | 78.75 |
| 27 | Grand Rapids-Wyoming, MI | 61.05 | 70.62 | 42.16 | 60.33 |
| 28 | Albuquerque, NM | 60.98 | 66.35 | 49.09 | 64.47 |
| 29 | Knoxville, TN | 59.95 | 67.43 | 45.16 | 59.44 |
| 30 | Syracuse, NY | 59.59 | 53.41 | 58.48 | 99.99 |
| 31 | Cleveland-Elyria, OH | 59.53 | 69.76 | 54.9 | 12.04 |
| 32 | Portland-Vancouver-Hillsboro, OR-WA | 58.76 | 59.06 | 52.42 | 76.01 |
| 33 | San Francisco-Oakland-Hayward, CA | 57.25 | 62.67 | 57.96 | 22.65 |
| 34 | Sacramento-Roseville-Arden-Arcade, CA | 56.04 | 67.31 | 42.02 | 30.5 |
| 35 | Riverside-San Bernardino-Ontario, CA | 55.4 | 64.43 | 34.31 | 64.5 |
| 36 | Pittsburgh, PA | 55.12 | 46.56 | 83.12 | 22.49 |
| 37 | Columbus, OH | 53.45 | 55.51 | 51.55 | 46.8 |
| 38 | Allentown-Bethlehem-Easton, PA-NJ | 52.38 | 54.86 | 64.9 | 0.01 |
| 39 | Greensboro-High Point, NC | 51.66 | 59.37 | 37.57 | 47.67 |
| 40 | Phoenix-Mesa-Scottsdale, AZ | 51.14 | 60.98 | 46.07 | 7.34 |
| 41 | Akron, OH | 49.84 | 53.81 | 56.19 | 6.95 |
| 42 | Indianapolis-Carmel-Anderson, IN | 49.61 | 40.67 | 61.85 | 66.58 |
| 43 | Memphis, TN-AR-MS | 49.51 | 60.62 | 43.3 | 1.46 |
| 44 | Richmond, VA | 49.42 | 61.08 | 31.27 | 33.87 |
| 45 | Austin-Round Rock, TX | 49.01 | 53.38 | 47.8 | 26.35 |
| 46 | Raleigh, NC | 48.94 | 41.25 | 59.15 | 64.45 |
| 47 | Salt Lake City, UT | 47.77 | 46 | 40.25 | 80.99 |
| 48 | Charleston-North Charleston-Summerville, SC | 46.38 | 29.56 | 62.16 | 99.99 |
| 49 | Miami-Fort Lauderdale-West Palm Beach, FL | 45.8 | 49.04 | 21.84 | 98.26 |
| 50 | Las Vegas-Henderson-Paradise, NV | 45.79 | 56.54 | 39.55 | 0.01 |
| 51 | Toledo, OH | 44.71 | 51.38 | 46.29 | 0.01 |
| 52 | Tampa-St. Petersburg-Clearwater, FL | 43.34 | 46.61 | 29.5 | 65.28 |
| 53 | Cape Coral-Fort Myers, FL | 42.33 | 59.71 | 0 | 65.06 |
| 54 | Dayton, OH | 42.25 | 57.22 | 17.15 | 27.76 |
| 55 | Nashville-Davidson-Murfreesboro-Franklin, TN | 41.77 | 49.17 | 14.8 | 78.36 |
| 56 | St. Louis, MO-IL | 41.62 | 50.97 | 23.12 | 41.02 |
| 57 | Tulsa, OK | 40.94 | 49.62 | 37.23 | 0.01 |
| 58 | Atlanta-Sandy Springs-Roswell, GA | 40.05 | 43.18 | 26.94 | 60.61 |
| 59 | Oklahoma City, OK | 39.35 | 39.81 | 51.53 | 0.01 |
| 60 | Kansas City, MO-KS | 38.69 | 43.09 | 31.83 | 32.85 |
| 61 | Baton Rouge, LA | 37.92 | 49.04 | 25.9 | 7.19 |
| 62 | Jacksonville, FL | 37.6 | 49.37 | 21.4 | 15.61 |
| 63 | San Antonio-New Braunfels, TX | 33.86 | 42.25 | 22.85 | 16.51 |
| 64 | Houston-The Woodlands-Sugar Land, TX | 33.83 | 32.84 | 27 | 60.26 |
| 65 | North Port-Bradenton-Sarasota, FL | 32.91 | 34.96 | 33.32 | 19.38 |
| 66 | Dallas-Ft. Worth-Arlington, TX | 32.05 | 34.66 | 21.08 | 49.26 |
| 67 | Detroit-Warren-Dearborn, MI | 31 | 38.73 | 23.77 | 6.26 |
| 68 | Albany-Schenectady-Troy, NY | 22.68 | 27 | 15.24 | 19 |
| 69 | Birmingham-Hoover, AL | 22.22 | 22.34 | 29.39 | 0.01 |
| 70 | Baltimore-Columbia-Towson, MD | 20.76 | 22.56 | 8.74 | 46.05 |
| 71 | Little Rock-North Little Rock-Conway, AR | 20.45 | 23.89 | 20.4 | 0.01 |
Sample
For this report, we analyzed 71 of the most populated metro areas (MSAs) in the U.S. (per the U.S. Census Bureau) for which all required data was available.
Metrics and Data Sources
The metrics used to create the “Competitive Score” were quarterly vacancy rates, the estimated average time on market of apartments in the MSAs, and the median cost per square foot of an apartment in the MSA. To compute the score, these metrics were normalized and combined using a weighted average.
To create the “Competitive Trend Score,” we took the normalized difference between the Q1 2023 Competitive Score and the Q1 2022 Competitive Score. To create the “Price Trend Score,” we took the normalized difference between the Q1 2023 median cost per square foot of an apartment in the MSA and the Q1 2022 median cost per square foot.
The vacancy rate data came from the U.S. Census Bureau. Time on market and cost per square foot data came from ApartmentAdvisor. We used a min/max data normalization approach.
Ranking
The Overall Score was calculated with a weighted average of the Q1 2023 Competitive Score (60% weight), the normalized year-over-year competitive score change from Q1 2022 to Q1 2023 (30% weight), and the normalized year-over-year median cost per square foot change from Q1 2022 to Q1 2023 (10% weight). The highest final score is considered the “most competitive.” The Final Rank is calculated by ranking the metro areas where the highest final score is the most competitive.
Notes About the Data
For more information about this study, please contact <pr@apartmentadvisor.com>.


Top cities
Atlanta Apartments
1,292 apartments starting at $600/month
Austin Apartments
2,333 apartments starting at $500/month
Baltimore Apartments
1,150 apartments starting at $475/month
Boston Apartments
5,443 apartments starting at $400/month
Charlotte Apartments
1,365 apartments starting at $525/month
Chicago Apartments
7,048 apartments starting at $638/month
Dallas Apartments
2,564 apartments starting at $695/month
Fort Worth Apartments
1,374 apartments starting at $559/month
Houston Apartments
3,029 apartments starting at $593/month
Las Vegas Apartments
706 apartments starting at $700/month
Los Angeles Apartments
10,624 apartments starting at $601/month
Miami Apartments
346 apartments starting at $1,045/month
Milwaukee Apartments
1,073 apartments starting at $595/month
New York Apartments
3,884 apartments starting at $1,000/month
Oakland Apartments
402 apartments starting at $850/month
Orlando Apartments
485 apartments starting at $700/month
Philadelphia Apartments
2,880 apartments starting at $525/month
Phoenix Apartments
2,303 apartments starting at $595/month
Pittsburgh Apartments
797 apartments starting at $500/month
Portland Apartments
1,878 apartments starting at $594/month
Raleigh Apartments
671 apartments starting at $615/month
San Antonio Apartments
1,988 apartments starting at $495/month
San Diego Apartments
2,053 apartments starting at $875/month
San Francisco Apartments
289 apartments starting at $1,000/month
San Jose Apartments
295 apartments starting at $1,200/month
Seattle Apartments
3,064 apartments starting at $690/month
Tampa Apartments
588 apartments starting at $675/month
Washington DC Apartments
1,695 apartments starting at $988/month