
Best Cities for Renters Right Now: Here’s Where Renters Will Have The Easiest Time Finding A Perfect Place

By Lilly Milman
Jun 15, 2023
Last month, we published a study highlighting the most competitive rental markets in the U.S. These locations were characterized by low vacancy rates, lack of affordable housing, and high demand — all factors that make it much harder for renters to find an apartment.
So, where are the places that present the best opportunities for renters right now? Where will renters have an easier time finding their perfect place?
To find out, we analyzed 71 of the largest metropolitan areas in the country, calculating an Ease of Renting Score that factored in vacancy rates, apartment price trends, and demand/days on market. We also considered economic opportunity for renters in each metro, analyzing median income, rent burden, and unemployment rates. As explained in our methodology, all of this came together in an overall Opportunity Score for each market, with the highest scores having the most opportunity for renters.
Below, we've highlighted the top 10 metro areas on our list. You can find the full-ranked list of all 71 metro areas we looked at here.
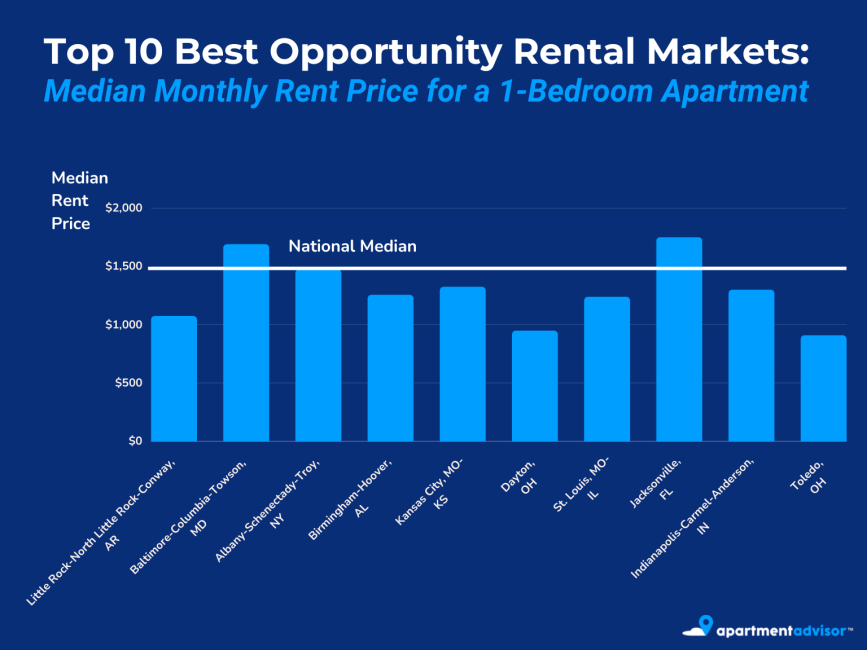
Top 10 Best Opportunity Rental Markets in Q1 2023
| Rank | Metro Area | Opportunity Score | Ease of Renting Score | Economic Score | Median Rent |
|---|---|---|---|---|---|
| 1 | Little Rock-North Little Rock-Conway, AR | 82.25 | 79.55 | 84.96 | $1,075 |
| 2 | Baltimore-Columbia-Towson, MD | 79.46 | 79.24 | 79.68 | $1,690 |
| 3 | Albany-Schenectady-Troy, NY | 78.16 | 77.32 | 78.99 | $1,476 |
| 4 | Birmingham-Hoover, AL | 78.01 | 77.78 | 78.24 | $1,256 |
| 5 | Kansas City, MO-KS | 74.06 | 61.31 | 86.8 | $1,325 |
| 6 | Dayton, OH | 74 | 57.75 | 90.26 | $949 |
| 7 | St. Louis, MO-IL | 71.29 | 58.38 | 84.2 | $1,239 |
| 8 | Jacksonville, FL | 69.22 | 62.4 | 76.04 | $1,750 |
| 9 | Indianapolis-Carmel-Anderson, IN | 68.92 | 50.39 | 87.46 | $1,300 |
| 10 | Toledo, OH | 68.02 | 55.29 | 80.76 | $909 |
Southern States Show Signs of Opportunity
Arkansas is a land of opportunity, according to our calculations. The scored the No. 1 spot on our list of Best Opportunity Rental Markets. Two other southern metro areas — Birmingham–Hoover, AL and Jacksonville, FL — also landed spots in the top 10, at No. 4 and No. 8, respectively.
Little Rock, AR is One of the Easiest Places to Find an Apartment
The Little Rock metro area topped our list with an Opportunity Score of 82.3 — indicating less competitiveness in the rental market, a less severe score on our , higher vacancy rates, and a lower unemployment rate than many other cities on our full list.
Despite rent hikes across the city in recent years, Little Rock still has the fourth lowest median rent for a one-bedroom apartment on our list at $1,075 per month — and a hypothetical renter earning the median income would be spending a little over a third of their income on a one-bedroom apartment according to our Rent Burden Index.
However, based on our data, it should still be easier to rent an apartment in the Little Rock metro area than in many other cities. At 11.2% (Q1 US Census), the vacancy rate is higher here than in most other markets, which means there’s ample availability. And the median rent price is $425 below the national median of $1500. Southern cities also tend to have a lower cost of living than northern cities, and Little Rock is no exception.
Ohio Offers the Most Opportunity Rental Markets
Ohio is the only state with two of the top 10 Best Opportunity Rental Markets on our list, and four in the top 20. Many of Ohio’s metro areas offer relatively high median incomes and rent prices that are lower than the majority of the country, making it an attractive state for renters right now.
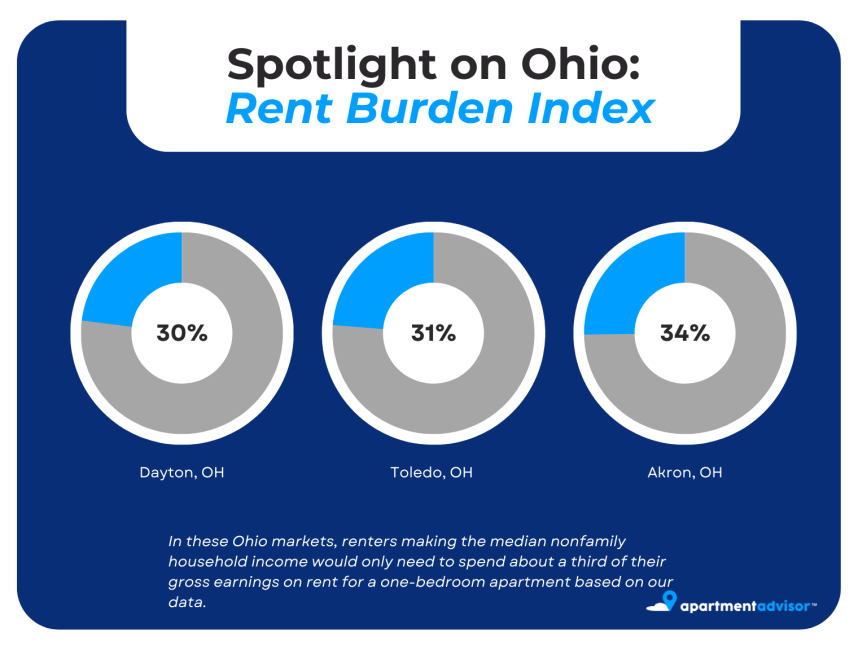
Ohio Renters are Less Rent Burdened
Low rents and comparatively high median incomes make Ohio one of the least rent-burdened states on our list. Four of the top five metro areas with the lowest median rent prices for one-bedroom apartments on our list are in Ohio — and three of those metro areas (Toledo, Dayton, and Akron, OH) have a median rent price below $1,000 a month for one-bedroom apartment — making them some of the best cities to get a good bang for your buck as a renter. These same three markets also clock in at the top five lowest scores on our Rent Burden Index. In Dayton — No. 6 on our list — renters making the nonfamily median income would only need to spend 30% of their gross income on a one-bedroom apartment at the median price, making it the most affordable market on our list. Toledo is not far behind, at 31% for the same metric. While they were not in our top 10 list of Best Opportunity Rental Markets, Akron, Cleveland–Elyria, and Columbus all also have a Rent Burden Index score of 34% — the fourth lowest figure on our list.
Two Coastal Cities Make the Top 10
Coastal cities tend to have strong job markets, be densely populated and popular for renters, and expensive — which is a subject we’ve covered before. In our Most Competitive Rental Markets report, the majority of the markets in our top 10 list were coastal cities. However, the has snagged the No. 2 spot, while Jacksonville, FL came in at No. 8 for Best Opportunity Rental Markets. The next highest coastal metro area on the list of Best Opportunity Rental Markets is Portland–Vancouver–Hillsboro, OR–WA at No. 37.
Baltimore is One of the Least Competitive Rental Markets in the Country
The Baltimore metro area is the second least competitive market on our list, due to a comparatively high vacancy rate of 12.8% and a relatively high average time on market. While the median rent price for a one-bedroom apartment is above the national median at $1,690 a month, the median nonfamily income is also high at $52,281 — creating a Rent Burden Index score on the lower end of our list. This means that an individual making the median income and renting a one-bedroom apartment alone would hypothetically spend 39% of their gross income on rent.

Below is the full-ranked list of all 71 cities we analyzed.
The Best Opportunity Rental Markets in Q1 2023
| Rank | Metro Area | Opportunity Score | Ease of Renting Score | Economic Score | Median Rent |
|---|---|---|---|---|---|
| 1 | Little Rock-North Little Rock-Conway, AR | 82.25 | 79.55 | 84.96 | $1,075 |
| 2 | Baltimore-Columbia-Towson, MD | 79.46 | 79.24 | 79.68 | $1,690 |
| 3 | Albany-Schenectady-Troy, NY | 78.16 | 77.32 | 78.99 | $1,476 |
| 4 | Birmingham-Hoover, AL | 78.01 | 77.78 | 78.24 | $1,256 |
| 5 | Kansas City, MO-KS | 74.06 | 61.31 | 86.8 | $1,325 |
| 6 | Dayton, OH | 74 | 57.75 | 90.26 | $949 |
| 7 | St. Louis, MO-IL | 71.29 | 58.38 | 84.2 | $1,239 |
| 8 | Jacksonville, FL | 69.22 | 62.4 | 76.04 | $1,750 |
| 9 | Indianapolis-Carmel-Anderson, IN | 68.92 | 50.39 | 87.46 | $1,300 |
| 10 | Toledo, OH | 68.02 | 55.29 | 80.76 | $909 |
| 11 | Salt Lake City, UT | 67.97 | 52.23 | 83.72 | $1,728 |
| 12 | Oklahoma City, OK | 67.75 | 60.65 | 74.85 | $1,318 |
| 13 | Akron, OH | 67.62 | 50.16 | 85.07 | $995 |
| 14 | Nashville-Davidson-Murfreesboro-Franklin, TN | 67.25 | 58.23 | 76.27 | $1,892 |
| 15 | Dallas-Ft. Worth-Arlington, TX | 67.19 | 67.95 | 66.43 | $2,045 |
| 16 | Detroit-Warren-Dearborn, MI | 66.38 | 69 | 63.76 | $1,390 |
| 17 | Columbus, OH | 66.22 | 46.55 | 85.89 | $1,346 |
| 18 | San Antonio-New Braunfels, TX | 65.31 | 66.14 | 64.48 | $1,695 |
| 19 | Atlanta-Sandy Springs-Roswell, GA | 64.88 | 59.95 | 69.81 | $1,995 |
| 20 | Houston-The Woodlands-Sugar Land, TX | 64.76 | 66.17 | 63.35 | $1,605 |
| 21 | Tulsa, OK | 64.71 | 59.06 | 70.36 | $1,295 |
| 22 | Austin-Round Rock, TX | 64.42 | 50.99 | 77.85 | $1,950 |
| 23 | Richmond, VA | 62.89 | 50.58 | 75.2 | $1,514 |
| 24 | Milwaukee-Waukesha-West Allis, WI | 62.33 | 33.22 | 91.43 | $1,164 |
| 25 | Raleigh, NC | 62.21 | 51.06 | 73.36 | $1,850 |
| 26 | Omaha-Council Bluffs, NE-IA | 61.5 | 27.26 | 95.75 | $1,157 |
| 27 | Cincinnati, OH-KY-IN | 60.4 | 38.57 | 82.24 | $1,300 |
| 28 | Greensboro-High Point, NC | 60.27 | 48.34 | 72.21 | $1,285 |
| 29 | Pittsburgh, PA | 59.83 | 44.88 | 74.79 | $1,250 |
| 30 | Baton Rouge, LA | 59.77 | 62.08 | 57.46 | $1,400 |
| 31 | Cleveland-Elyria, OH | 59.48 | 40.47 | 78.49 | $1,095 |
| 32 | Grand Rapids-Wyoming, MI | 59.31 | 38.95 | 79.66 | $1,498 |
| 33 | Charleston-North Charleston-Summerville, SC | 58.3 | 53.62 | 62.99 | $2,101 |
| 34 | Phoenix-Mesa-Scottsdale, AZ | 57.96 | 48.86 | 67.07 | $2,095 |
| 35 | Memphis, TN-AR-MS | 57.5 | 50.49 | 64.51 | $1,250 |
| 36 | Syracuse, NY | 57.36 | 40.41 | 74.31 | $1,275 |
| 37 | Portland-Vancouver-Hillsboro, OR-WA | 57.21 | 41.24 | 73.19 | $1,789 |
| 38 | Virginia Beach-Norfolk-Newport News, VA-NC | 57.06 | 37.93 | 76.19 | $1,665 |
| 39 | Allentown-Bethlehem-Easton, PA-NJ | 56.89 | 47.62 | 66.17 | $1,595 |
| 40 | Denver-Aurora-Lakewood, CO | 56.2 | 37.35 | 75.06 | $2,096 |
| 41 | Tampa-St. Petersburg-Clearwater, FL | 55.32 | 56.66 | 53.98 | $2,161 |
| 42 | Louisville/Jefferson County, KY-IN | 55.25 | 26.19 | 84.31 | $1,200 |
| 43 | Seattle-Tacoma-Bellevue, WA | 54.41 | 31.47 | 77.35 | $2,106 |
| 44 | Hartford-West Hartford-East Hartford, CT | 54.24 | 36.99 | 71.49 | $1,587 |
| 45 | North Port-Bradenton-Sarasota, FL | 53.62 | 67.09 | 40.16 | $2,800 |
| 46 | Buffalo-Cheektowaga-Niagara Falls, NY | 53.31 | 33.19 | 73.43 | $1,200 |
| 47 | Rochester, NY | 52.97 | 27.23 | 78.7 | $1,195 |
| 48 | Albuquerque, NM | 52.64 | 39.02 | 66.26 | $1,500 |
| 49 | Knoxville, TN | 52.33 | 40.05 | 64.61 | $1,637 |
| 50 | Sacramento-Roseville-Arden-Arcade, CA | 51.87 | 43.96 | 59.79 | $2,147 |
| 51 | Washington-Arlington-Alexandria, DC-VA-MD-WV | 51.85 | 23.88 | 79.82 | $2,300 |
| 52 | Charlotte-Concord-Gastonia, NC-SC | 51.69 | 32.62 | 70.75 | $1,797 |
| 53 | San Francisco-Oakland-Hayward, CA | 51.29 | 42.75 | 59.84 | $2,934 |
| 54 | San Jose-Sunnyvale-Santa Clara, CA | 50.7 | 27.58 | 73.81 | $3,100 |
| 55 | Chicago-Naperville-Elgin, IL-IN-WI | 49.52 | 37.96 | 61.07 | $1,800 |
| 56 | Columbia, SC | 46.95 | 27.61 | 66.29 | $1,462 |
| 57 | Urban Honolulu, HI | 44.76 | 36.06 | 53.47 | $2,423 |
| 58 | Cape Coral-Fort Myers, FL | 44.71 | 57.67 | 31.76 | $2,600 |
| 59 | Providence-Warwick, RI-MA | 42.89 | 35.17 | 50.6 | $1,950 |
| 60 | Las Vegas-Henderson-Paradise, NV | 42.33 | 54.21 | 30.44 | $1,975 |
| 61 | Boston-Cambridge-Newton, MA-NH | 41.78 | 29.15 | 54.42 | $3,000 |
| 62 | Orlando-Kissimmee-Sanford, FL | 41.63 | 34.2 | 49.06 | $2,150 |
| 63 | Fresno, CA | 40.83 | 37.24 | 44.42 | $1,800 |
| 64 | Bridgeport-Stamford-Norwalk, CT | 40.65 | 30.63 | 50.67 | $2,564 |
| 65 | New Haven-Milford, CT | 40.65 | 31.54 | 49.76 | $1,800 |
| 66 | Miami-Fort Lauderdale-West Palm Beach, FL | 39.15 | 54.2 | 24.1 | $2,900 |
| 67 | Worcester, MA | 37.64 | 18.89 | 56.4 | $1,773 |
| 68 | San Diego-Carlsbad, CA | 36.06 | 25.55 | 46.57 | $2,760 |
| 69 | Riverside-San Bernardino-Ontario, CA | 35.16 | 44.6 | 25.73 | $2,595 |
| 70 | Los Angeles-Long Beach-Anaheim, CA | 34.88 | 35.83 | 33.92 | $2,900 |
| 71 | New York-Newark-Jersey City, NY-NJ-PA | 33.08 | 37.26 | 28.89 | $2,895 |
Sample
For this report, we analyzed 71 of the most populated metro areas (MSAs) in the U.S. (per the U.S. Census Bureau) for which all required data was available.
Metrics and Data Sources
The metrics used to create the “Economic Score” were the unemployment rate and a Rent Burden Index. We calculated this score using a weighted average of the unemployment rate of an MSA (40%) and the Rent Burden Index (60%).
The “Rent Burden Index” is meant to estimate the rent burden for a hypothetical individual renting a one-bedroom apartment in the MSA. It was calculated by comparing nonfamily household median incomes and median one-bedroom monthly rent prices in each MSA.
In a previous report, we created a “Competitive Score” using quarterly vacancy rates, the estimated average time on market of apartments in the MSAs, and the median cost per square foot of an apartment in the MSA. To learn more about how we calculated the Competitive Score, read the full methodology of the Most Competitive Rental Markets report here. The "Ease of Renting Score" is the inverted Competitive Score.
The vacancy rates, unemployment rates, and nonfamily household median income data came from the U.S. Census Bureau. Time on market, cost per square foot, and median monthly one-bedroom rent price data came from ApartmentAdvisor. We used a min/max data normalization approach when computing scores.
Ranking
To compute the “Opportunity Score,” we combined the Ease of Renting Score and the Economic Score, weighted equally.
Notes About the Data
For more information about this study, please contact pr@apartmentadvisor.com.


Top cities
Atlanta Apartments
1,292 apartments starting at $600/month
Austin Apartments
2,333 apartments starting at $500/month
Baltimore Apartments
1,150 apartments starting at $475/month
Boston Apartments
5,443 apartments starting at $400/month
Charlotte Apartments
1,365 apartments starting at $525/month
Chicago Apartments
7,048 apartments starting at $638/month
Dallas Apartments
2,564 apartments starting at $695/month
Fort Worth Apartments
1,374 apartments starting at $559/month
Houston Apartments
3,029 apartments starting at $593/month
Las Vegas Apartments
706 apartments starting at $700/month
Los Angeles Apartments
10,624 apartments starting at $601/month
Miami Apartments
346 apartments starting at $1,045/month
Milwaukee Apartments
1,073 apartments starting at $595/month
New York Apartments
3,884 apartments starting at $1,000/month
Oakland Apartments
402 apartments starting at $850/month
Orlando Apartments
485 apartments starting at $700/month
Philadelphia Apartments
2,880 apartments starting at $525/month
Phoenix Apartments
2,303 apartments starting at $595/month
Pittsburgh Apartments
797 apartments starting at $500/month
Portland Apartments
1,878 apartments starting at $594/month
Raleigh Apartments
671 apartments starting at $615/month
San Antonio Apartments
1,988 apartments starting at $495/month
San Diego Apartments
2,053 apartments starting at $875/month
San Francisco Apartments
289 apartments starting at $1,000/month
San Jose Apartments
295 apartments starting at $1,200/month
Seattle Apartments
3,064 apartments starting at $690/month
Tampa Apartments
588 apartments starting at $675/month
Washington DC Apartments
1,695 apartments starting at $988/month